4.2.1.8. Access to WCS data
The CEDA data server at https://data.cci.ceda.ac.uk/ provides access via the OGC Web Coverage Service (WCS) to CCI datasets. This notebook demonstrates how to retrieve CCI data via WCS from the CEDA server, using OWSLib as the client.
If owslib is not already installed in the Python environment, uncomment the following cell to install it with mamba.
[1]:
# ! mamba install --yes owslib
Import some required libraries, including OWSLib as the WCS client.
[2]:
from owslib.wcs import WebCoverageService
import xarray as xr
from esa_climate_toolbox.core import list_ecvs, list_ecv_datasets
%matplotlib inline
import matplotlib.pyplot as plt
<frozen abc>:106: FutureWarning: xarray subclass VectorDataCube should explicitly define __slots__
Define a simple convenience class CciWcs to manage the web service.
[3]:
class CciWcs:

    def __init__(self, dataset_id: str):
        self.service = WebCoverageService(
            f"https://data.cci.ceda.ac.uk/thredds/wcs/{dataset_id}?service=WCS&version=1.0.0",
            version="1.0.0"
        )

    def coverage(self, data_id: str, bbox: tuple[float]) -> xr.Dataset:
        coverage = self.service.getCoverage(
          identifier=data_id,
          bbox=bbox,
          format="NetCDF3",
          timeout=600
        )
        with open("coverage.nc", "wb") as fh:
            fh.write(coverage.read())
        return xr.open_dataset("coverage.nc")
List the available ECVs.
[4]:
list_ecvs()
[4]:
['SEASTATE',
 'AEROSOL',
 'SEAICE',
 'ICESHEETS',
 'BIOMASS',
 'RD',
 'PERMAFROST',
 'OC',
 'SOILMOISTURE',
 'SST',
 'VEGETATION',
 'FIRE',
 'GHG',
 'WATERVAPOUR',
 'SNOW',
 'LC',
 'SEASURFACESALINITY',
 'LAKES',
 'LST',
 'OZONE',
 'CLOUD',
 'SEALEVEL']
List the available datasets for the Land Surface Temperature (LST) ECV.
[5]:
print("\n".join(map(lambda x: x[0], list_ecv_datasets("LST"))))
esacci.LST.3-hours.L3S.LST.multi-sensor.multi-platform.IRMGP.1-00.r1
esacci.LST.day.L3C.LST.AATSR.Envisat.ATSR_3.3-00.DAY
esacci.LST.day.L3C.LST.AATSR.Envisat.ATSR_3.3-00.NIGHT
esacci.LST.day.L3C.LST.ATSR-2.ERS-2.ATSR_2.3-00.DAY
esacci.LST.day.L3C.LST.ATSR-2.ERS-2.ATSR_2.3-00.NIGHT
esacci.LST.day.L3C.LST.MODIS.Aqua.MODISA.3-00.DAY
esacci.LST.day.L3C.LST.MODIS.Aqua.MODISA.3-00.NIGHT
esacci.LST.day.L3C.LST.MODIS.Terra.MODIST.3-00.DAY
esacci.LST.day.L3C.LST.MODIS.Terra.MODIST.3-00.NIGHT
esacci.LST.day.L3C.LST.SLSTR.Sentinel-3A.SLSTRA.3-00.DAY
esacci.LST.day.L3C.LST.SLSTR.Sentinel-3A.SLSTRA.3-00.NIGHT
esacci.LST.day.L3C.LST.SLSTR.Sentinel-3B.SLSTRB.3-00.DAY
esacci.LST.day.L3C.LST.SLSTR.Sentinel-3B.SLSTRB.3-00.NIGHT
esacci.LST.day.L3C.LST.multi-sensor.multi-platform.SSMI_SSMIS.v2-33.ASC
esacci.LST.day.L3C.LST.multi-sensor.multi-platform.SSMI_SSMIS.v2-33.DES
esacci.LST.day.L3S.LST.multi-sensor.multi-platform.IRCDR.2-00.DAY
esacci.LST.day.L3S.LST.multi-sensor.multi-platform.IRCDR.2-00.NIGHT
esacci.LST.mon.L3C.LST.AATSR.Envisat.ATSR_3.3-00.DAY
esacci.LST.mon.L3C.LST.AATSR.Envisat.ATSR_3.3-00.NIGHT
esacci.LST.mon.L3C.LST.ATSR-2.ERS-2.ATSR_2.3-00.DAY
esacci.LST.mon.L3C.LST.ATSR-2.ERS-2.ATSR_2.3-00.NIGHT
esacci.LST.mon.L3C.LST.MODIS.Aqua.MODISA.3-00.DAY
esacci.LST.mon.L3C.LST.MODIS.Aqua.MODISA.3-00.NIGHT
esacci.LST.mon.L3C.LST.MODIS.Terra.MODIST.3-00.DAY
esacci.LST.mon.L3C.LST.MODIS.Terra.MODIST.3-00.NIGHT
esacci.LST.mon.L3C.LST.SLSTR.Sentinel-3A.SLSTRA.3-00.DAY
esacci.LST.mon.L3C.LST.SLSTR.Sentinel-3A.SLSTRA.3-00.NIGHT
esacci.LST.mon.L3C.LST.SLSTR.Sentinel-3B.SLSTRB.3-00.DAY
esacci.LST.mon.L3C.LST.SLSTR.Sentinel-3B.SLSTRB.3-00.NIGHT
esacci.LST.mon.L3C.LST.multi-sensor.multi-platform.SSMI_SSMIS.v2-33.ASC
esacci.LST.mon.L3C.LST.multi-sensor.multi-platform.SSMI_SSMIS.v2-33.DES
esacci.LST.mon.L3S.LST.multi-sensor.multi-platform.IRCDR.2-00.DAY
esacci.LST.mon.L3S.LST.multi-sensor.multi-platform.IRCDR.2-00.NIGHT
esacci.LST.mon.L3S.LST.multi-sensor.multi-platform.IRMGP.1-00.00:00UTC
esacci.LST.mon.L3S.LST.multi-sensor.multi-platform.IRMGP.1-00.03:00UTC
esacci.LST.mon.L3S.LST.multi-sensor.multi-platform.IRMGP.1-00.06:00UTC
esacci.LST.mon.L3S.LST.multi-sensor.multi-platform.IRMGP.1-00.09:00UTC
esacci.LST.mon.L3S.LST.multi-sensor.multi-platform.IRMGP.1-00.12:00UTC
esacci.LST.mon.L3S.LST.multi-sensor.multi-platform.IRMGP.1-00.15:00UTC
esacci.LST.mon.L3S.LST.multi-sensor.multi-platform.IRMGP.1-00.18:00UTC
esacci.LST.mon.L3S.LST.multi-sensor.multi-platform.IRMGP.1-00.21:00UTC
esacci.LST.yr.L3C.LST.multi-sensor.multi-platform.SSMI_SSMIS.v2-33.ASC
esacci.LST.yr.L3C.LST.multi-sensor.multi-platform.SSMI_SSMIS.v2-33.DES
Select a dataset from the list and store its name in a variable for use in the following steps.
[6]:
ds_id = "esacci.LST.mon.L3S.LST.multi-sensor.multi-platform.IRCDR.2-00.DAY"
Create a local representation of the WCS service for the selected dataset.
[7]:
cciwcs = CciWcs(ds_id)
List the data variables available from this service.
[8]:
list(cciwcs.service.contents.keys())
[8]:
['solaz',
 'lst_unc_ran',
 'lst_unc_loc_cor',
 'dtime',
 'lst_unc_loc_sfc',
 'lst',
 'lcc',
 'n',
 'satze',
 'solze',
 'lst_unc_loc_atm',
 'lst_uncertainty',
 'sataz']
Select the lst variable from the list and store its name in a variable.
[9]:
data_id = "lst"
Check the bounding box for the selected dataset and variable; we can see that it is of global extent.
[10]:
cciwcs.service.contents[data_id].boundingBoxWGS84
[10]:
(-179.9949951171875, -89.99500274658203, 179.9949951171875, 89.99498748779297)
For a quick demonstration with a small amount of data, request a coverage for a small sub-region and return it as a xarray dataset.
[11]:
ds = cciwcs.coverage(
    data_id="lst",
    bbox=(9.7, 53.3, 10.3, 53.5)
)
Show some of the metadata for the returned coverage.
[12]:
ds
[12]:
<xarray.Dataset> Size: 2MB
Dimensions:  (time: 294, lat: 21, lon: 61)
Coordinates:
  * time     (time) datetime64[ns] 2kB 1995-08-01 1995-09-01 ... 2020-12-01
  * lat      (lat) float32 84B 53.31 53.31 53.32 53.34 ... 53.48 53.49 53.51
  * lon      (lon) float32 244B 9.705 9.715 9.725 9.735 ... 10.28 10.29 10.31
Data variables:
    lst      (time, lat, lon) float32 2MB ...
Attributes: (12/43)
    source:                     ESA LST CCI IRCDR L3S V2.00
    title:                      ESA LST CCI land surface temperature time ser...
    institution:                University of Leicester
    history:                    2023-05-24 17:10:44: The CCI Open Data Portal...
    references:                 https://climate.esa.int/en/projects/land-surf...
    Conventions:                CF-1.8
    ...                         ...
    key_variables:              land_surface_temperature
    format_version:             CCI Data Standards v2.2
    spatial_resolution:         0.01 degree
    doi:                        10.5285/785ef9d3965442669bff899540747e28
    tracking_id:                66f44ae9-1873-48be-a2df-c349022a9a97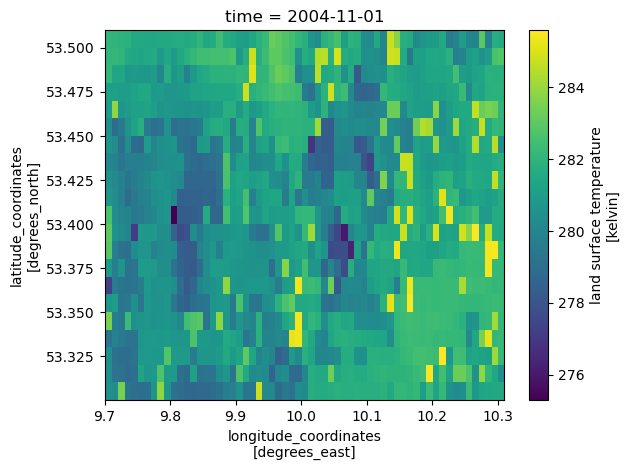
History: Translated to CF-1.0 Conventions by Netcdf-Ja...Use the coverage data to plot a map of land surface temperature for a specific point in time.
[13]:
ds.lst.isel(time=100).plot.imshow()
[13]:
<matplotlib.image.AxesImage at 0x7fa880314140>
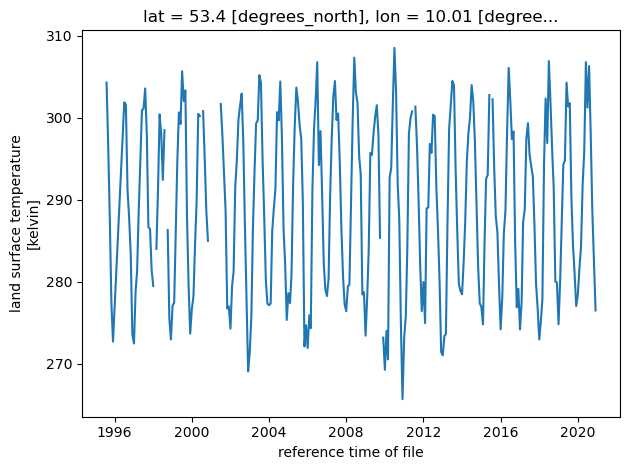
Use the coverage data to plot a graph of land surface temperature against time for a specific location.
[14]:
ds.lst.sel(lat=53.4, lon=10.0, method="nearest").plot()
[14]:
[<matplotlib.lines.Line2D at 0x7fa87d47d7c0>]