4.2.1.4. ESA CCI Toolbox Vector Data Access
The ESA CCI Toolbox also provides access to data that is not provided on a structured grid. This data is provided in the form of geopandas geodataframes rather than xarray datasets.
To run this Notebook, make sure the ESA CCI Toolbox is setup correctly.
For this notebook, we start as before, by opening the standard esa-cci data store.
[1]:
from xcube.core.store import new_data_store

cci_store = new_data_store('esa-cci')
<frozen abc>:106: FutureWarning: xarray subclass VectorDataCube should explicitly define __slots__
The data in question are GHG, SEALEVEL, and SEAICE datasets in satellite-orbit-frequency. Let’s search for GHG datasets.
[2]:
descriptors = cci_store.search_data(
    data_type="geodataframe",
    cci_attrs=dict(
        ecv="GHG"
    )
)
[descriptor.data_id for descriptor in descriptors]
Dataset is not accessible via Opendap or Download
Dataset is not accessible via Opendap or Download
Dataset is not accessible via Opendap or Download
/home/tonio-bc/projects/esa-cci/xcube-cci/xcube_cci/cciodp.py:1960: CciOdpWarning: Variable "gain" has no fill value, cannot set one. For parts where no data is available you will see random values. This is usually the case when data is missing for a time step.
  warnings.warn(f'Variable "{fixed_key}" has no fill value, '
/home/tonio-bc/projects/esa-cci/xcube-cci/xcube_cci/cciodp.py:1960: CciOdpWarning: Variable "l1b_name" has no fill value, cannot set one. For parts where no data is available you will see random values. This is usually the case when data is missing for a time step.
  warnings.warn(f'Variable "{fixed_key}" has no fill value, '
/home/tonio-bc/projects/esa-cci/xcube-cci/xcube_cci/cciodp.py:1960: CciOdpWarning: Variable "exposure_id" has no fill value, cannot set one. For parts where no data is available you will see random values. This is usually the case when data is missing for a time step.
  warnings.warn(f'Variable "{fixed_key}" has no fill value, '
[2]:
['esacci.GHG.satellite-orbit-frequency.L2.CH4.SCIAMACHY.Envisat.IMAP.v7-2.r1',
 'esacci.GHG.satellite-orbit-frequency.L2.CH4.SCIAMACHY.Envisat.WFMD.v4-0.r1',
 'esacci.GHG.satellite-orbit-frequency.L2.CH4.TANSO-FTS-2.GOSAT-2.SRFP.v2-0-2.r1',
 'esacci.GHG.satellite-orbit-frequency.L2.CH4.TANSO-FTS-2.GOSAT-2.SRPR.v2-0-2.r1',
 'esacci.GHG.satellite-orbit-frequency.L2.CH4.TANSO-FTS.GOSAT.EMMA.ch4_v1-2.r1',
 'esacci.GHG.satellite-orbit-frequency.L2.CH4.TANSO-FTS.GOSAT.OCFP.v2-1.r1',
 'esacci.GHG.satellite-orbit-frequency.L2.CH4.TANSO-FTS.GOSAT.OCPR.v7-0.r1',
 'esacci.GHG.satellite-orbit-frequency.L2.CH4.TANSO-FTS.GOSAT.SRFP.v2-3-8.r1',
 'esacci.GHG.satellite-orbit-frequency.L2.CH4.TANSO-FTS.GOSAT.SRPR.v2-3-8.r1',
 'esacci.GHG.satellite-orbit-frequency.L2.CH4.TROPOMI.Sentinel-5P.WFMD.v1-8.r1',
 'esacci.GHG.satellite-orbit-frequency.L2.CO2.OCO.OCO-2.FOCAL.v10-1.r1',
 'esacci.GHG.satellite-orbit-frequency.L2.CO2.SCIAMACHY.Envisat.BESD.v02-01-02.r1',
 'esacci.GHG.satellite-orbit-frequency.L2.CO2.SCIAMACHY.Envisat.WFMD.v4-0.r1',
 'esacci.GHG.satellite-orbit-frequency.L2.CO2.TANSO-FTS-2.GOSAT-2.SRFP.v2-0-2.r1',
 'esacci.GHG.satellite-orbit-frequency.L2.CO2.TANSO-FTS.GOSAT.EMMA.v2-2c.r1',
 'esacci.GHG.satellite-orbit-frequency.L2.CO2.TANSO-FTS.GOSAT.OCFP.v7-0-1.r1',
 'esacci.GHG.satellite-orbit-frequency.L2.CO2.TANSO-FTS.GOSAT.SRFP.v2-3-8.r1',
 'esacci.GHG.satellite-orbit-frequency.L2.CO2.multi-sensor.multi-platform.EMMA.v2-2a.r1',
 'esacci.GHG.satellite-orbit-frequency.L2.CO2.multi-sensor.multi-platform.EMMA.v2-2b.r1']
We have a closer look at the first one.
[3]:
descriptors[0]
[3]:
<xcube.core.store.descriptor.GeoDataFrameDescriptor at 0x7efeac4baf60>
It makes sense to not open the whole dataframe but read in a subset. We ask for two variables for one day (the variable names are listed under feature_schema:properties).
[4]:
var_names = ["xch4", "xco2_retrieved"]
time_range = ["2010-07-04", "2010-07-04"]

ghg_df = cci_store.open_data(
    "esacci.GHG.satellite-orbit-frequency.L2.CH4.SCIAMACHY.Envisat.IMAP.v7-2.r1",
    variable_names=var_names,
    time_range=time_range
)
ghg_df
[4]:
| geometry | xch4 | xco2_retrieved | time | |
|---|---|---|---|---|
| 0 | POINT (21.12531 66.15704) | 1835.639282 | 350.589783 | 2010-07-04T00:00:00 |
| 1 | POINT (17.33319 54.23273) | 1848.246216 | 350.940857 | 2010-07-04T00:00:00 |
| 2 | POINT (21.32617 53.16351) | 1834.837891 | 361.529053 | 2010-07-04T00:00:00 |
| 3 | POINT (17.02777 53.6568) | 1767.532104 | 357.012085 | 2010-07-04T00:00:00 |
| 4 | POINT (15.31268 53.61804) | 1846.445312 | 384.051636 | 2010-07-04T00:00:00 |
| ... | ... | ... | ... | ... |
| 3546 | POINT (176.04736 62.59637) | 1756.709839 | 379.857666 | 2010-07-04T00:00:00 |
| 3547 | POINT (173.65729 62.86865) | 1774.327759 | 357.646545 | 2010-07-04T00:00:00 |
| 3548 | POINT (174.71912 62.44507) | 1805.762573 | 374.800110 | 2010-07-04T00:00:00 |
| 3549 | POINT (173.18512 62.00031) | 1841.642090 | 350.549011 | 2010-07-04T00:00:00 |
| 3550 | POINT (171.62189 61.54938) | 1752.140625 | 350.487610 | 2010-07-04T00:00:00 |
3551 rows × 4 columns
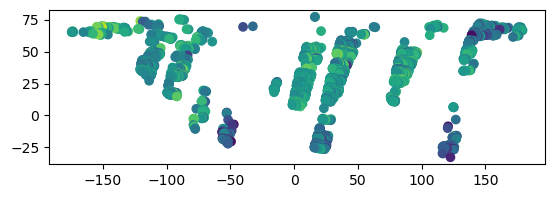
[5]:
ghg_df.plot(column="xch4")
[5]:
<Axes: >
[ ]: